Uptime Monitor
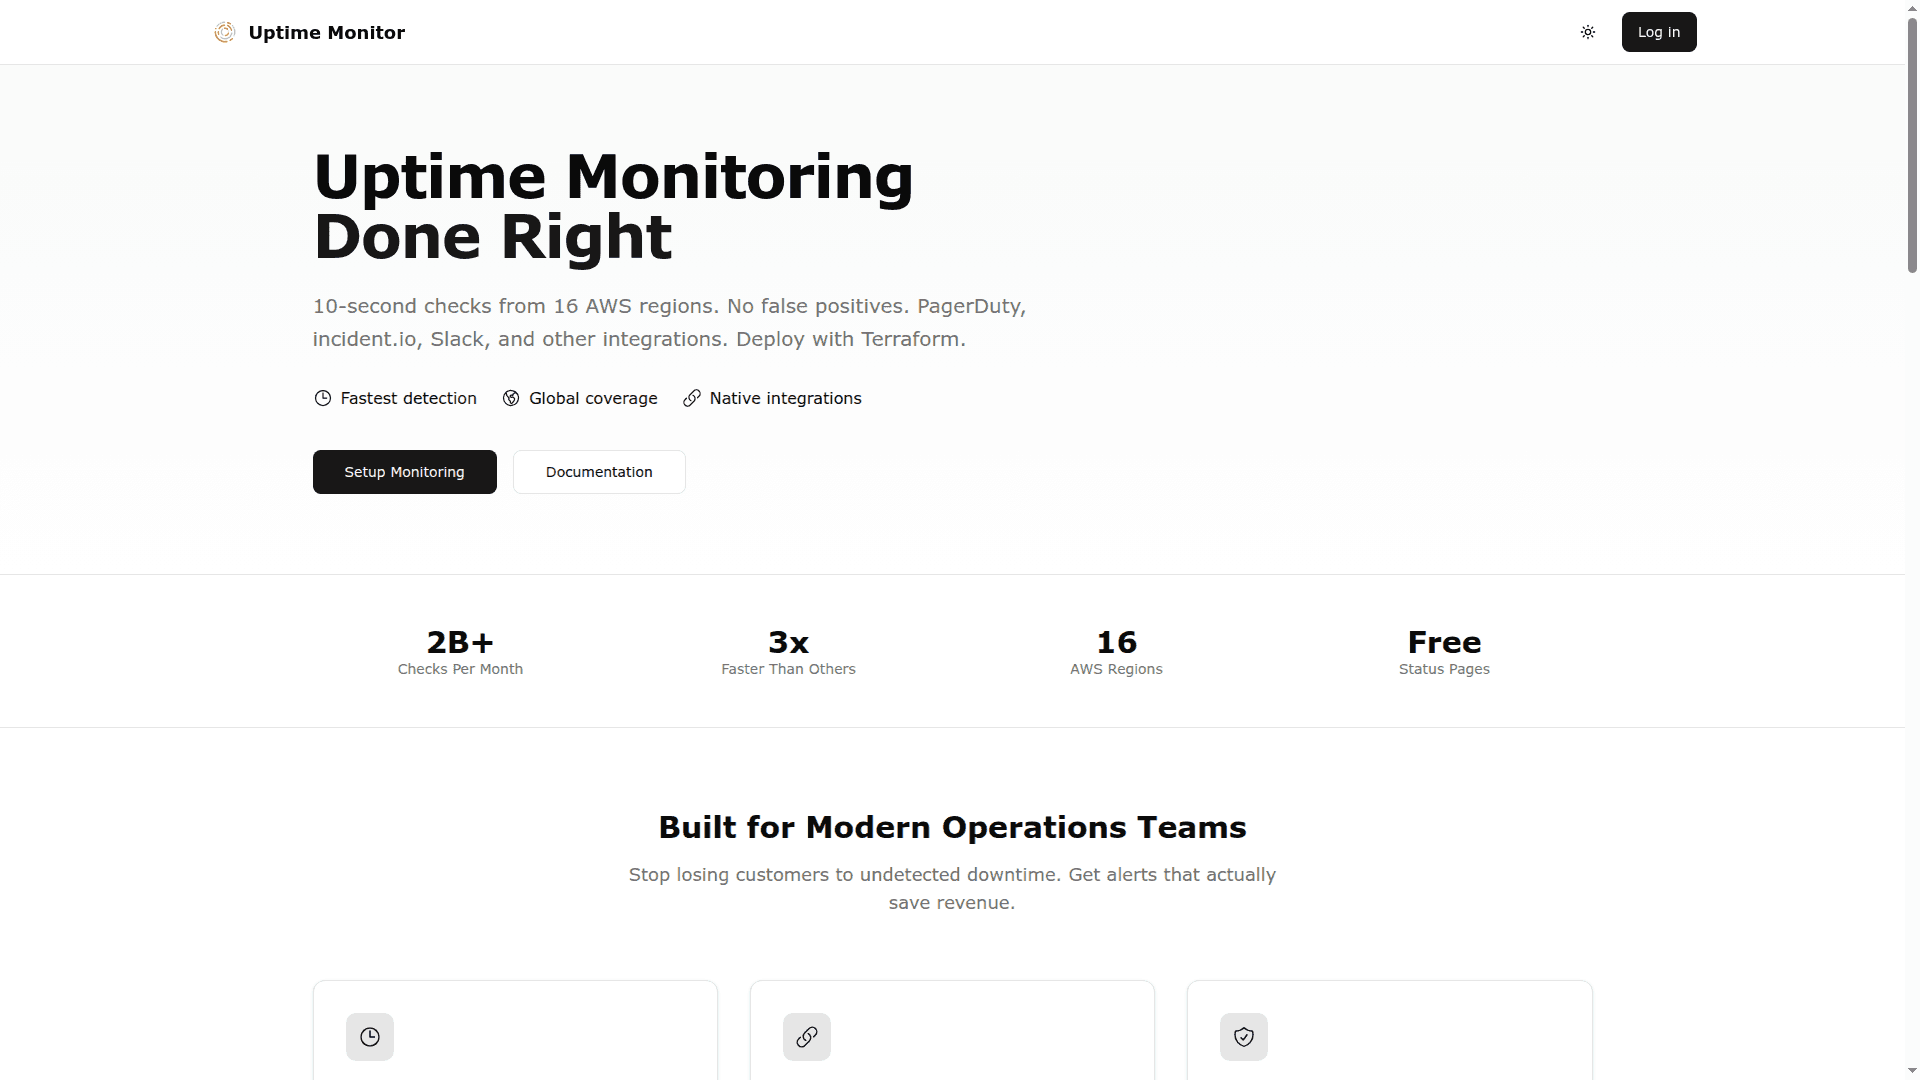
Uptime Monitoring Done Right

Uptime Monitor provides the fastest website and service monitoring with 10-second checks from 16 AWS regions. It offers native integrations with PagerDuty, incident.io, Slack, and more, along with Terraform support. Features include real-time alerts, multi-region verification to prevent false positives, and professional status pages. Plans start with a free tier and a Pro plan from $4.95/mo.
What this service is
Uptime Monitor is an always‑on watcher for your websites, APIs, and services that alerts you the moment something goes wrong. It focuses on speed, reliability, and clean integrations so your team can act fast and stay confident. (uptime-monitor.io)
Why your Back Office will care
It reduces revenue risk by catching outages in seconds, not minutes, so your on‑call playbooks kick in before customers flood support. (uptime-monitor.io)
It fits neatly into existing processes, which means fewer manual steps, less swivel‑chair work, and clearer audit trails for incident reviews. (uptime-monitor.io)
It’s infrastructure‑as‑code friendly, so operations can manage monitors, contacts, and status pages alongside the rest of your stack. (uptime-monitor.io)
Speed that actually prevents problems
You get checks every 10 seconds, so issues surface roughly 3× faster than the common 30–180 second intervals many tools use. (uptime-monitor.io)
At 10‑second cadence, that’s 8,640 checks per day per monitor, giving you far earlier detection and tighter MTTA/MTTR. (uptime-monitor.io)
Global coverage with fewer false alarms
Monitors run from 16 AWS regions, so you see what your users see around the world. (uptime-monitor.io)
Multi‑region verification and fail‑thresholds help avoid paging on single‑region blips, keeping alerts meaningful and actionable. (uptime-monitor.io)
Fits your incident workflow out of the box
Native integrations with incident.io and PagerDuty create and resolve incidents automatically with the right context for your responders. (uptime-monitor.io)
Alerts respect your escalation policies and include useful metadata (what failed, where, and how), so on‑call engineers can jump straight to the fix. (uptime-monitor.io)
Infrastructure‑as‑code, done right
A full Terraform provider lets you version‑control monitors, contacts, and even status pages, just like the rest of your infrastructure. (uptime-monitor.io)
You can templatize environments (prod, staging) and roll out consistent monitoring with repeatable plans and reviews. (uptime-monitor.io)
Clear status for customers and colleagues
Build public status pages on your own domain to set expectations during incidents and maintain trust with transparent updates. (uptime-monitor.io)
Spin up internal, password‑protected pages for leadership and support so everyone stays aligned without noisy back‑and‑forth. (uptime-monitor.io)
Getting started is simple
You can start free and add monitors in minutes, then layer on regions, alerting contacts, and status pages as your needs grow. (uptime-monitor.io)
Recommended setup for a solid Back Office
Use 10–60 second checks for critical services and set the fail threshold to 2–3 regions to balance speed with accuracy. (uptime-monitor.io)
Route critical alerts to incident.io or PagerDuty, and keep Slack/Discord/webhooks for broader team awareness. (uptime-monitor.io)
Define monitors, contacts, and status pages in Terraform so changes are reviewed, auditable, and consistent across environments. (uptime-monitor.io)
Pause monitors during maintenance windows and keep naming conventions tidy to streamline incident reviews and reporting. (uptime-monitor.io)
The bottom line
If you want a monitoring layer that’s fast, noise‑aware, and workflow‑ready, Uptime Monitor gives your Back Office the confidence to catch issues early, escalate cleanly, and communicate clearly—without adding operational drag. (uptime-monitor.io)
